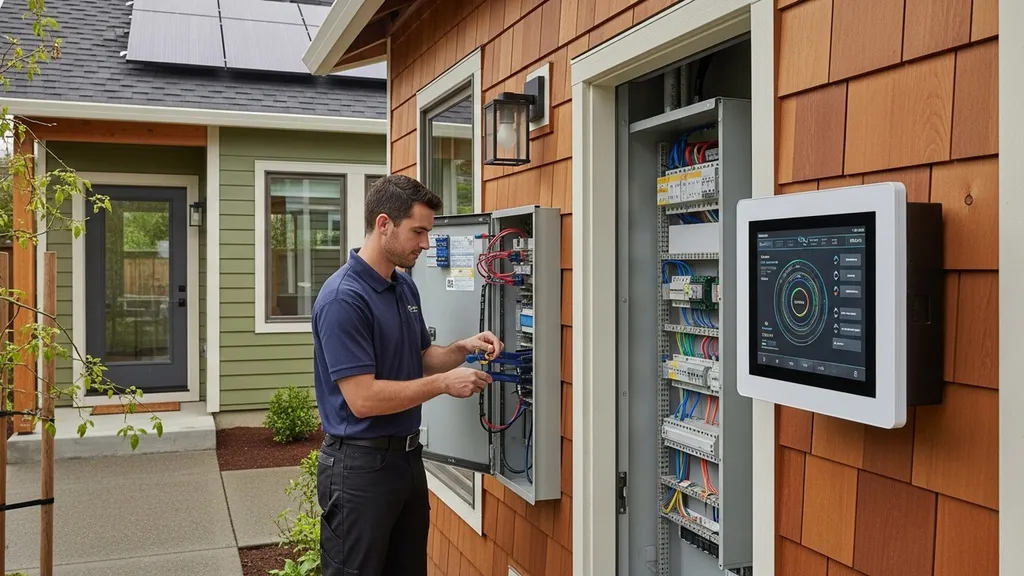
How to monitor a net zero home: what to measure, tools, hardware choices, data logging, and practical tips to track energy use and hit net-zero goals.
Monitoring Your Net Zero Home: Tracking Energy Use
A newly finished net-zero house can still surprise its owners with higher-than-expected electricity bills. Net zero monitoring gives you the visibility to compare actual performance against the modeled design, spot system faults, and change behavior to meet your goals. This guide explains what to measure, which hardware and dashboards work well for DIY homebuilders, how to wire and log data reliably, and practical workflows for grid-tied, hybrid, and off-grid setups so your house performs like it was designed.
TL;DR:
- Measure whole-home energy and PV production with 15-minute resolution to spot gaps; expect modeled vs actual deviations of 10–30% in many projects.
- Use a local or hybrid dashboard (Home Assistant + Grafana or vendor portal) with CSV export and alerts; add CT clamps and inverter telemetry for detailed views.
- Start today: install a whole-home meter, log a baseline week, add CTs on solar and critical circuits, and set simple alerts for high overnight loads.
Why Monitor a Net Zero Home? Goals, Risks, and What Success Looks Like
Net zero monitoring is the ongoing process of measuring energy flows, storage, and building performance so the home consumes no more energy (typically on an annual basis) than it produces. Homeowners often build to a modeled target—HERS, Passive House, or local energy models—but actual use can differ. Research and industry reports show typical deviations between modeled and measured energy use commonly range from 10% to 30% for residential retrofits and new builds, depending on occupant behavior and system commissioning.
Monitoring matters for three practical reasons:
- Cost control: Detect unexpected loads or inefficient appliances before they become large bills.
- Comfort and health: Verify ventilation, temperature, and humidity stay within design ranges.
- Maintenance and resilience: Spot failing inverters, battery issues, or wiring faults early.
Common gaps that monitoring reveals:
- Envelope losses from missed air-sealing details or thermal bridging.
- System mismatches like oversized HVAC cycling or PV orientation losses.
- Occupant behaviors such as always-on electric heaters, extended ventilation runtime, or EV charging at night.
Use simple KPIs to define success: daily kWh consumption, peak kW, PV production per kW of installed panels, battery state-of-charge (SoC) and days of autonomy for off-grid systems. For benchmarks and how modeled assumptions map to measured results, see the net-zero build primer.
What to Measure: Key Metrics Every Net Zero Monitoring Plan Needs
Aim to capture electrical, renewable, storage, and building performance metrics. Each metric listed below includes units, frequency recommendation, and why it matters.
Electrical Metrics
- Instantaneous power (kW): Measure real-time draw at the main. Frequency: sub-minute to 1-minute for high-resolution troubleshooting. Shows peaks and base load.
- Energy (kWh): Cumulative energy used per hour/day. Frequency: 15-minute or hourly aggregation for reporting and billing comparisons.
- Power factor and voltage (PF, V): Useful for commercial-grade equipment and some inverters; low PF can indicate harmonics or motor issues.
- Disaggregation (circuit-level kW): Helps identify appliances contributing most to consumption (HVAC, EV charger, dryer). Use smart plugs for individual appliances.
Renewables & Storage
- PV production (kW, kWh): Inverter telemetry gives array output and per-string performance. Expect roughly 3–5 kWh/day per kW of south-facing PV in many temperate locations; this varies with latitude and shading.
- Inverter status and fault codes: Instant detection of string faults or clipping events.
- Battery SoC (%), charge/discharge power (kW), cycles: Vital for hybrid and off-grid systems. Log at 5–15 minute intervals for pattern analysis.
Building Performance
- Indoor temperature and humidity (°C/°F, %RH): Place sensors in main living spaces and bedrooms; log every 5–15 minutes.
- HVAC runtime (minutes/hour): Correlate runtime to energy use to find inefficiencies.
- Ventilation rates and CO2 (ppm): CO2 sensors can validate ventilation effectiveness; combined with ERV/HRV runtime to ensure IAQ.
Measurement frequency guidance:
- Real-time (sub-minute to 1-minute) for safety signals and inverter faults.
- 15-minute aggregation for energy reporting and aligning with many smart inverter portals.
- Daily summaries for homeowner reporting and trend spotting.
For how monitored metrics map to performance scores such as HERS or EnergyScore, consult the HERS score primer. For ventilation measurement locations and balanced ventilation guidance, see balanced ventilation design.
Monitoring Tools and Dashboards: Platforms, Open-source Options, and What to Look For
Dashboards turn raw telemetry into actionable insight. Three common types are vendor cloud portals, local dashboards, and open-source stacks.
Vendor cloud portals (examples: Enphase, SolarEdge):
- Pros: Easy setup, inverter-native telemetry, mobile apps.
- Cons: Data ownership and export capabilities vary.
Local dashboards (Home Assistant + Grafana + InfluxDB):
- Pros: Full data ownership, local control, strong automation hooks.
- Cons: More setup time and occasional maintenance.
Open-source and hybrid setups:
- Home Assistant provides device integrations and automations; Grafana + InfluxDB offers high-quality charts and long-term retention. Use MQTT or Modbus gateways for inverter telemetry where available.
Key dashboard features to require:
- Real-time charts and 15-minute aggregation
- Alerting for thresholds (e.g., overnight consumption > X kWh)
- Historical comparisons and CSV export
- Device-level drill-down and annotation capability
Comparison table — dashboards and trade-offs:
| Solution type | Cost | Data ownership | Setup difficulty |
|---|---|---|---|
| Vendor cloud (inverter portal) | Low–Free | Vendor-controlled | Low |
| Home Assistant + Grafana (local) | Low–Medium | Owner-controlled | Medium–High |
| Hybrid (local + cloud backup) | Medium | Owner-controlled with cloud backup | Medium |
What to watch weekly on dashboards:
- Ratio of PV production to home consumption
- Overnight base-load kWh (should be low in net-zero homes)
- Peak exports and battery charge windows
Watch a concise walkthrough to see common dashboards and live signals. The video shows a typical Home Assistant + Grafana setup and how to spot production and load patterns:
Watch this step-by-step guide on installing a home energy monitor:
For appliance-level validation and load-shifting strategies, pair monitoring with our efficient appliances guide.
Note: For larger projects or if investor reporting is required, check guidance like the Implementing net-zero: a guide for asset owners to align monitoring with reporting needs.
Choosing Monitoring Hardware: Meters, CT Clamps, Smart Inverters and Battery Monitors
Choosing the right hardware depends on the level of detail and whether you will DIY the installation.
Whole-home Metering vs Circuit-level Monitoring
- Whole-home meter: A bi-directional meter at the service entrance provides total import/export and is essential for net metering verification. Installation typically requires an electrician.
- Circuit-level monitoring: CT clamps on individual breakers or smart circuit monitors reveal circuit-specific loads. Good for identifying high consumers like EV chargers, dryers, or HVAC.
Solar & Inverter Telemetry
Ask your installer whether the inverter provides open telemetry (Modbus or API) and whether you can access data without vendor cloud lock-in. For retrofit solar additions, see questions to ask in the adding solar tips.
Battery and EV Monitoring
Track SoC, instantaneous charge/discharge power, cycle count, and temperature. These metrics help diagnose degradation; see the battery troubleshooting tips for examples of how monitoring data reveals common faults.
Comparison table — monitoring hardware at a glance:
| Device type | Typical data provided | Installation complexity | Cost bracket |
|---|---|---|---|
| Whole-home smart meter | Import/export kWh, real-time kW | Electrician | $ |
| Split-core CT clamp monitor | Circuit kW, energy | DIY-friendly (panel access) | $–$ |
| Inverter telemetry gateway | PV kW, string data, fault codes | Installer or DIY with gateway | $–$$ |
| Battery monitor | SoC %, cycles, kW | Installer (high-voltage) | $$ |
| Smart plugs | Appliance kW, energy | Plug-and-play | $ |
Accuracy notes:
- Good CT clamp systems report within ±1–3% for residential loads when installed correctly.
- Whole-home meters used for billing may have tighter tolerances; check meter class for verification.
Safety guidance: Use an electrician for anything inside the main service panel or when working with live high-voltage battery systems. Clamp-on CTs that attach to insulated wires are often a safe DIY entry point.
For expected production benchmarks by system size, consult sizing guides such as the 2 kW solar guide, 7 kW solar sizing, and the 10 kW system guide.
Setting Up Data Collection and Logging: Wiring, Network, Privacy, and Reliability
A plan for wiring, telemetry protocols, and data retention prevents costly rework.
Physical Wiring and Telemetry Options
- Run CT tails and communication cables to a dedicated data-logger location near the main panel. Leave a 20–30 cm service loop and label conductors.
- Common telemetry protocols: Modbus TCP/RTU for inverters and battery systems; MQTT for sensor networks; Zigbee/Z-Wave or Wi‑Fi for small sensors.
- If your hybrid system includes a gateway with Modbus RTU over RS485, plan a conduit run from the panel to the gateway location.
Edge vs Cloud Logging
- Edge (local) logging: Home Assistant + InfluxDB stores raw data locally; preferred for privacy and offline capability. Use a small NAS or Raspberry Pi with an external drive for retention.
- Cloud logging: Vendor portals simplify setup but you depend on vendor uptime and data access policies. Hybrid setups that export CSV backups mitigate risk.
Best practices for data retention and privacy:
- Retain raw high-resolution data (15-minute) for 1 year; aggregate to daily or weekly for 7+ years if storage is limited.
- Keep a rolling backup: local NAS nightly snapshot plus monthly cloud archive.
- Use a unique network VLAN for SCADA/telemetry devices and apply strong passwords and firewall rules to protect inverter and battery APIs.
Reliability checklist:
- Install a UPS for your data logger to prevent data gaps during short outages.
- Configure cellular fallback or remote logging for off-grid systems where internet is unreliable.
- Monitor the monitoring system itself: set alerts for data gaps longer than one reporting interval.
For wiring steps and examples for hybrid systems, see the hybrid wiring guide. If logs show telemetry gaps, consult common fixes in the solar system troubleshooting article.
Using Monitoring to Optimize Performance: Actions That Reduce Energy Use and Reach Net Zero
Monitoring is most valuable when it leads to specific actions. Here are workflows and expected impacts.
Behavioral Changes and Automated Controls
- Shift high-draw tasks (EV charging, dishwasher, dryer) into midday PV availability using a simple automation rule in Home Assistant or the inverter EMS. Expected saving: increases self-consumption and reduces grid import; real savings depend on tariff structure.
- Reduce thermostat setbacks by small degrees or shorten heating cycles during low-occupancy hours. Example: lowering setpoint by 1°C can reduce heating energy by roughly 3–5% depending on climate.
Maintenance and Fault Detection
- Use abnormal inverter power drops or string mismatch to flag shading or panel soiling; cleaning or trimming can restore expected production quickly.
- Detect failing batteries via increased internal resistance (faster SoC swings) and higher than-expected temperature during charging.
Ventilation and Comfort Optimization
- Monitor CO2 and HVAC runtime: if CO2 rises above 1,000 ppm during occupied hours, increase ERV runtime. If ventilation runtime is excessive relative to CO2 and energy use, check ERV/HRV flow and balance. See ERV vs HRV comparison for guidance.
Workflow example — detect a persistent overnight base load:
- Dashboard shows overnight base load of 1.2 kW steady between 2–5 AM.
- Disaggregate circuits using CT clamps to reveal an always-on electric heater at 0.9 kW.
- Replace heater with a thermostatically controlled option or reconfigure schedule.
- Expected result: overnight base load drops to 0.3 kW, saving ~9 kWh/week.
Research into analytics and renewables indicates that data-driven actions can materially improve system performance when combined with targeted maintenances and controls (see analysis in this paper: S1364032124007871).
For envelope-related issues, pair monitoring with a blower door test and correct air-sealing procedures; see blower door testing.
Monitoring Workflows for Common Net Zero Setups: Grid-tied, Hybrid, and Off-grid Examples
Short, practical daily/weekly/monthly checks for each system type.
Grid-tied with Net Metering: Verify Export vs Consumption
Daily:
- Check PV production vs load; ensure exports align with sunny days.
Weekly:
- Verify net meter readings against your whole-home meter to confirm billing matches logged export.
Monthly:
- Compare monthly kWh import/export to model expectations.
Alarm thresholds:
- Unexpected export drop > 20% on sunny days — check inverter and shading.
Hybrid Systems with Batteries: SOC, Charge/discharge Patterns to Watch
Daily:
- Monitor battery SoC cycles and charging windows.
Weekly:
- Ensure battery charges predominantly from PV and discharges in evening peaks per set rules.
Monthly:
- Review cycle counts and depth-of-discharge trends for early signs of capacity fade.
Alarm thresholds:
- Battery SoC never exceeds 80% on full sun — check inverter limits or connection.
Off-grid Systems: Load Profiles, Autonomy Days, and Reserve Management
Daily:
- Track energy balance: PV production vs consumption and net deficit/surplus.
Weekly:
- Monitor days of autonomy; aim to maintain reserve target (e.g., 2–3 autonomy days).
Monthly:
- Re-assess seasonal production curves against model.
For system-specific sizing references and expected production figures, see the 2 kW solar guide, 7 kW solar sizing, and the 10 kW system guide. Ground-source heat pumps have different load profiles; read our geothermal basics for monitoring tips on those systems.
The Bottom Line
Net zero monitoring turns design intent into measurable performance: measure whole-home energy and PV production, choose a dashboard that gives you control and exports, and use monitoring to find and fix small issues before they grow. Start simple, add circuit-level visibility, and protect your logs with local backups.
Starter checklist:
- Install a whole-home meter or smart CT to capture total import/export.
- Add inverter telemetry access or a gateway for PV production data.
- Set up a dashboard (Home Assistant or vendor portal) with 15-minute aggregation.
- Log a baseline week and record typical occupancy schedules.
- Add CTs on EV charger and HVAC circuits.
- Configure alerts for unexpected high overnight loads and critical inverter faults.
Frequently Asked Questions
How accurate do my energy monitors need to be for net zero verification?
For household decisions and troubleshooting, CT clamps with ±1–3% accuracy are usually sufficient. If you need billing-grade verification for utility reporting or incentive programs, use a meter that meets the required meter class or utility specifications.
Compare whole-home meter readings to inverter production and circuit monitors to detect calibration drift; keep raw 15-minute data for at least a year to support any disputes.
Can I use a consumer plug monitor to track key loads?
Yes. Consumer plug monitors are a low-cost way to profile individual appliances and can reveal large consumers like space heaters or old refrigerators. They are best for appliances that stay plugged into convenient outlets. For hardwired loads (e.g., electric ovens, HVAC), use CT clamps or circuit monitors.
How often should I log data to trust comparisons with modeled energy use?
Collect at least 15-minute aggregated data; this resolution aligns with many inverter portals and gives a reliable basis for day-to-day and seasonal comparisons. For commissioning and transient fault detection, higher resolution (1-minute or sub-minute) can be useful temporarily.
Do I need to involve my utility when installing meters for monitoring?
Yes for anything that interacts with utility metering or changes the service entrance. Contact your utility before installing a bi-directional revenue meter or making changes that affect net metering. For internal CT-based monitoring that does not alter the service connection, utilities typically do not need to be involved, but check local regulations.
What’s the cheapest way to start monitoring a net zero home?
Start with a clamp-on energy monitor for the main service and a free or low-cost local dashboard like Home Assistant. Add a smart inverter gateway for PV telemetry and a couple of smart plugs to profile key appliances. This approach keeps upfront costs low while giving immediate visibility.